Create a multiple join
If your data table contains time-based records, with more than one record associated with each geographical feature, you can create a multiple join.
Steps are similar to a simple join, and you just need to define the Time Series Column of your data table first, in the Information tab your data table's Detail Panel:
Select the column that contains the date information of your records. Make sure you set your column's type to be date-time.
You can then link your layer to your data table. The Link Data window will indicate the number of records, linked, and the type of join: 1-to-N indicates that a multiple join was detected. 
Define aggregation type
When added to a map, time-based records will be aggregated in some of your map's tools and panels: the Table View, the Data tip, and the Info Tool.
You can define which aggregation method is to be used for each column of your time-based records. View the data of your data table and click on a column to access its properties. Select the appropriate aggregation method:
Available aggregation methods depend on your column's type.
Aggregation methods for integer include the following:
- Sum
- Maximum
- Minimum
- Average
Add and view your time-based data in your map
You can now create a map and use your joined dataset in any of the interactivity tools. Simply add your time-based columns as any regular column to any interactivity tool.
- Data tip: the data tip will show the aggregated values for each feature.
- Info Tool: the info tool will show the aggregate and individual values. You will be able to iterate through each sub-feature and see the individual data.

- Tables: the data table will show the aggregated values
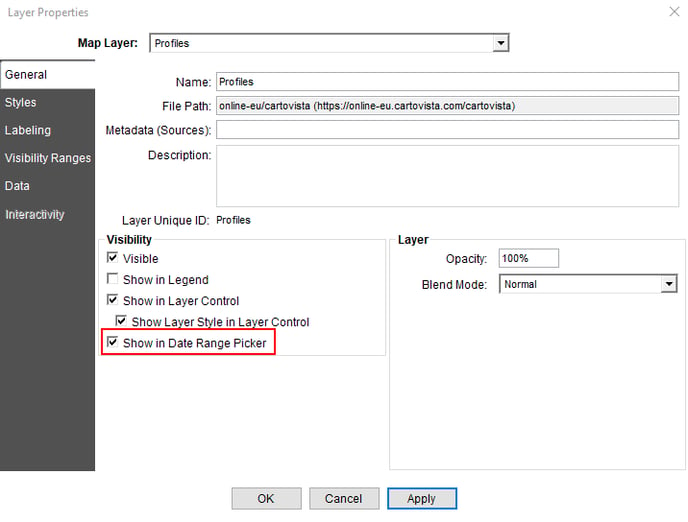
The Date Range Picker will be available as a floating window on your map:
In the Viewer Configurations, enable the Time View option if you want your users to get a chart view of your time-based data.
ℹ️ Check out this article to see how you can view the data once the map is published.