Analyze time-based vector data
Specific time-based tools allow you to analyze and explore time series data.
Get summarized and individual information on each feature
Time-based data is represented in the map to allow you to see the individual time records as well as an aggregation of these time-based records for each point, polygon, or line.
Thematics are an aggregated view of the time series. Based on the aggregation method that is applied on the map, you get to see either the sum, maximum, minimum, or average value for each point, polygon, or line.
The data tip and data table also display the aggregated value.
The info tool allows you to get the individual information as well as the aggregated value. Use one of the info tool ![]() or
or ![]() to click on a feature of the map. The info panel will first show the aggregated values. You can see the aggregation method in brackets. The individual values are displayed in the gray area. You can go from one time record to another using the arrows in the top right-hand corner of the gray area.
to click on a feature of the map. The info panel will first show the aggregated values. You can see the aggregation method in brackets. The individual values are displayed in the gray area. You can go from one time record to another using the arrows in the top right-hand corner of the gray area.

Use the Date Range Picker
Use the Date Ranger Picker to filter data with a certain period. The filter will have an impact on what you see on the map, in the data table view, and in the information tool. Each aggregated value will be computed based on the period you have selected.
Use the dropdown menu to select your layer:

Use the date picker to select a start and end date:
Time view chart
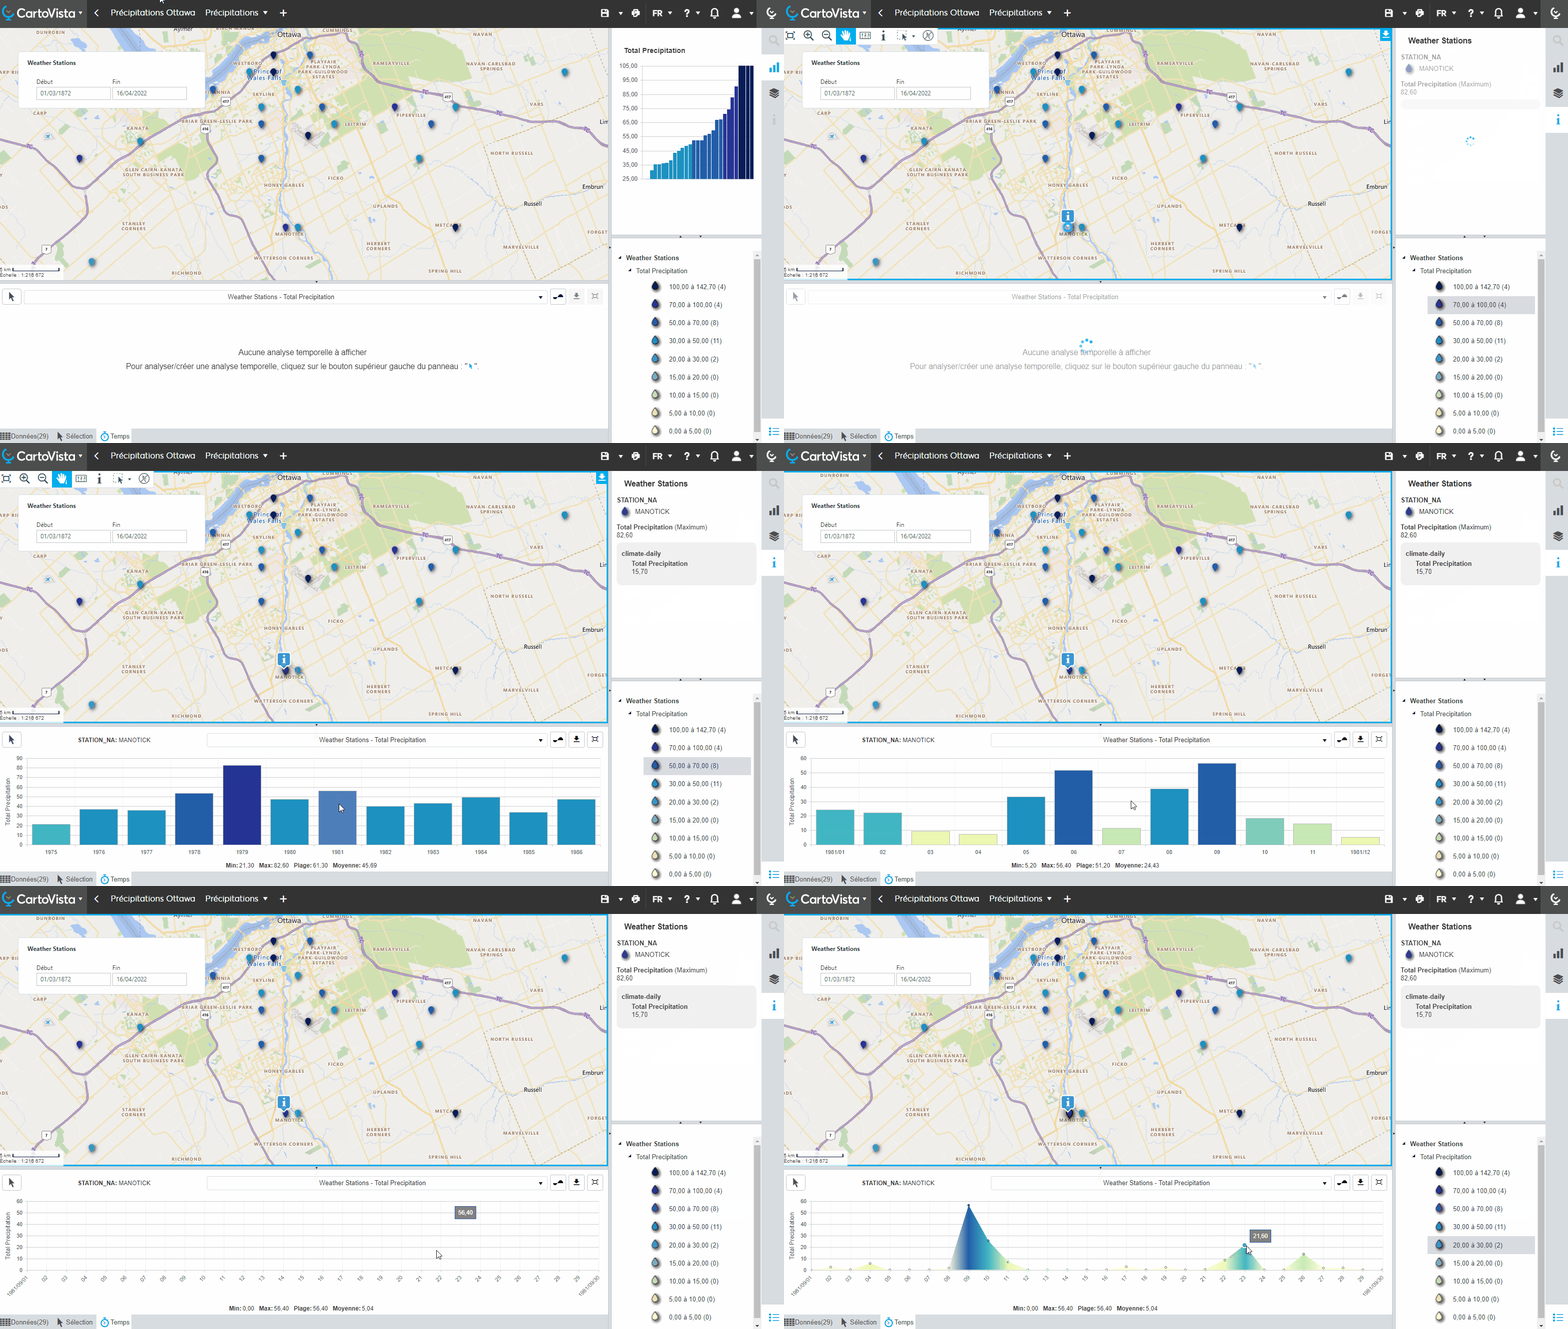
The time view chart allows you to create time based chart by clicking on a feature on the map.
- Click on the small "time" clock in the bottom panel of the CartoVista viewer on your map.

- Click the cursor button in the panel that opens.

- Using the cursor, click on the feature you want info on on your map. The time graph will appear instantly.
- The time graph will display data for each year, month or day, based on the period that has been selected. You can click on a year, month or day to see the precise evolution for this period. You can navigate through time this way. Click on this icon
 to go back to the initial chart view.

Time-based datasets can cover a large period of time, but sometimes with very few records over this period. In such cases, the aggregated view per year/month/day does not help, and it is better to use individual values directly.
![]()
Your graph will be updated with the individual values. If you want to go back to the aggregate values, you will have to click on this icon:
![]()